
Everyone Quotes Pet Industry Market Size. Few Know What It Actually Means.
Every pitch deck cites the $150 billion pet industry number. Sophisticated investors have seen it a thousand times and aren't moved. This breaks down what the top-line figure hides about segment dynamics, growth rates, and competitive reality—and how to use market data strategically.
Every pitch deck in the pet industry opens with the same slide: a big number, usually somewhere around $150 billion, with an arrow pointing up. Investors have seen it hundreds of times. The number is accurate. It's also nearly useless.
The problem isn't the data. It's that founders treat "pet industry market size" as validation instead of context. A $150 billion market tells you nothing about which segment you're competing in, where the margin actually lives, or whether the growth everyone cites is real expansion or just channel shift. Knowing the top-line number is table stakes. Understanding what it means is where strategy starts.
This isn't a data dump. APPA and Statista already do that well. This is what operators need to know about market size data to use it strategically.
The Numbers Everyone Cites
Pet industry market size in the US hit $151.9 billion in 2024, according to APPA. The projection for 2025 is $157 billion. These are the numbers you'll see in every industry report and conference keynote.
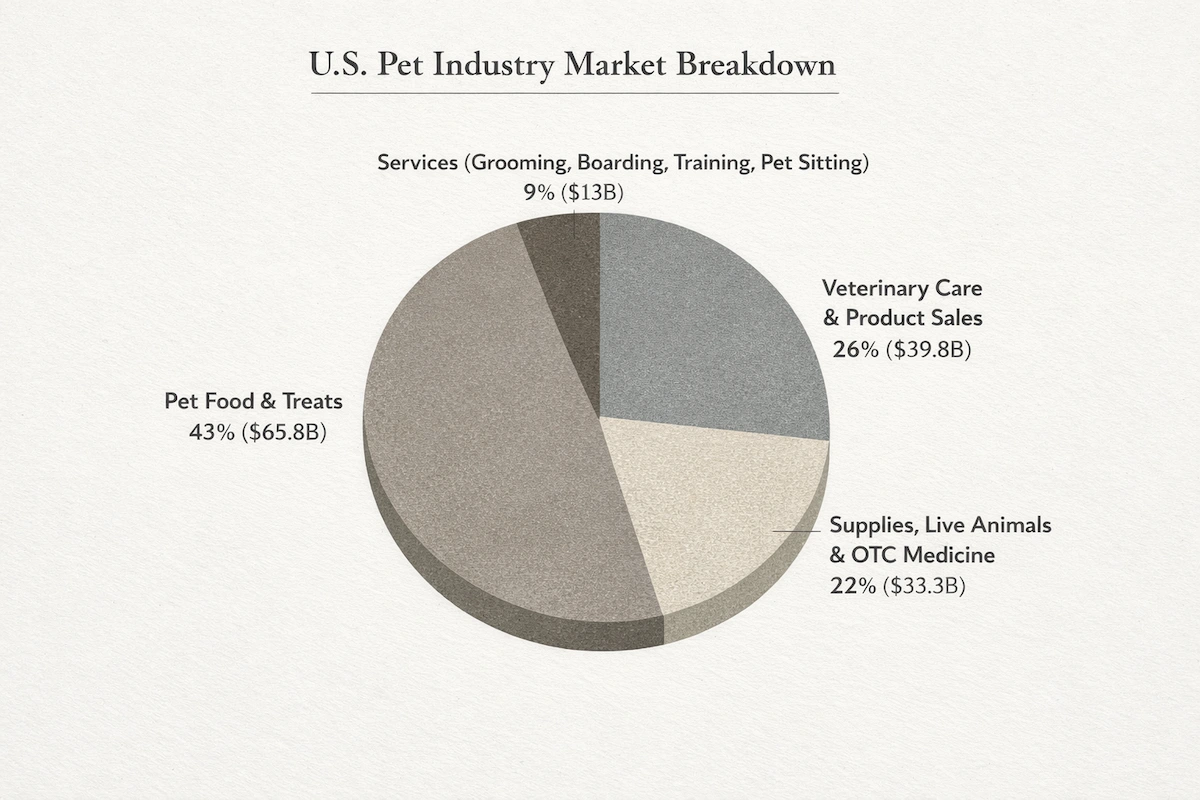
The breakdown matters more than the total:
Pet food and treats account for $65.8 billion, or 43% of the market. This is where most CPG founders compete—and where margins are thinnest due to commodity pressure and retail concentration.
Veterinary care and product sales represent $39.8 billion (26%). This includes everything from routine checkups to specialty procedures, plus the products sold through vet clinics.
Supplies, live animals, and OTC medicine total $33.3 billion (22%). Think toys, accessories, aquariums, and the growing category of pet supplements.
Services (grooming, boarding, training, pet sitting) make up $13 billion—just 9% of the total, but growing faster than any other segment.
Growth has normalized post-pandemic. The industry's 2020-2021 surge (19.3% year-over-year) was an anomaly driven by adoption spikes and stay-at-home spending. Current projections show 6.6% CAGR through 2031, which is healthy but not the hockey stick some founders pitch.
The ownership foundation: 51% of US households own a dog (68 million dogs), and 37% own a cat (49 million cats). Dogs dominate spending, but the cat segment is growing faster.
What "Pet Industry" Actually Includes
Here's where most founders make their first mistake: they cite the total market as if it's their addressable opportunity. It isn't.
"Pet industry" is a category so broad it loses meaning. A premium freeze-dried dog food brand and a veterinary telehealth platform both operate in the "pet industry." They share almost no customers, competitors, or unit economics. Citing the same $150 billion number in both pitch decks is technically true and strategically meaningless.
The aggregated number includes businesses that have nothing to do with each other: pet food manufacturing, veterinary clinics, grooming salons, pet insurance, aquarium supplies, equine products (sometimes), pet tech hardware, boarding facilities, and retail—both independent shops and the big-box chains. Some reports include veterinary pharmaceuticals. Others don't. The methodology varies by source, which is why you'll see market size estimates ranging from $130 billion to $170 billion depending on who's counting.
For operators, the question isn't "how big is the pet industry?" It's "which slice am I actually in, and what does that slice look like?"
A founder building a subscription treat brand is competing in a subset of that $65.8 billion food market—specifically, the premium treat segment, in the DTC channel, targeting a particular customer archetype. That addressable market might be $2 billion. Maybe $500 million. The $150 billion figure is backdrop, not opportunity.
This matters when talking to investors. Sophisticated investors discount the big number immediately. They want to hear you articulate your specific segment, its size, and why you can win there. "We're going after the $150B pet market" signals you haven't done the work. "We're targeting the $800M premium cat supplement segment, where the top 3 players have 60% share and haven't innovated in five years" signals you have.
Where the Growth Actually Lives
The top-line growth rate hides dramatic variation across segments. Not all 6.6% CAGR is created equal.
Services is the standout. Pet services (grooming, boarding, training, daycare) are growing at 16.5% CAGR through 2031. That's more than double the overall market rate. The segment is small—$13 billion—but velocity matters. This is where new business models are emerging and where consumer spending is actively shifting.
DTC and online channels are accelerating. Online retail now captures 32.4% of pet product sales, and DTC brands specifically are growing at 18.9% CAGR. This reflects both genuine e-commerce adoption and the rise of subscription/autoship models that lock in recurring revenue.
Cats are outpacing dogs. Dogs account for 60% of pet market spending, but the cat segment is growing at 7.8% CAGR—faster than dogs. The cat-owning demographic skews younger and more urban. Founders who dismiss the cat market because "dogs are bigger" are missing a segment with less competition and better growth dynamics.
Food growth is slowing. Pet food remains the largest segment by far, but growth has normalized. The pandemic-era demand surge is over. What's left is a mature category with fierce competition from both legacy players (Mars, Nestlé, J.M. Smucker) and well-funded insurgents. Growth here increasingly comes from premiumization—trading consumers up to higher-priced products—rather than volume expansion.
The interpretation matters: "the pet industry is growing" isn't useful strategy. Knowing that services are growing 2.5x faster than the overall market, while food is maturing, changes where a founder should allocate capital and attention.
The Margin Question Nobody Publishes
Market size data tells you where the revenue is. It doesn't tell you where the money is.
Food is the largest segment, but it's also the most competitive. The category is dominated by a handful of strategic acquirers (Mars, Nestlé, General Mills, J.M. Smucker) who operate at scale most founders can't match. Premium brands can achieve healthy gross margins, but getting there requires volume that takes years to build. Meanwhile, retail margin pressure is constant, and ingredient costs fluctuate with commodity markets. The majors have the scale to absorb volatility. Most startups don't.
Services, by contrast, operate on different economics. A pet boarding facility or grooming salon has local monopoly characteristics—customers choose based on convenience and trust, not national brand. Margins can be higher because competition is fragmented and price sensitivity is lower. The segment is smaller, but the unit economics can be meaningfully better.
Supplies and accessories sit in between. Margins depend heavily on whether you're selling commoditized products (leashes, bowls, basic toys) or differentiated ones (premium beds, tech-enabled accessories, subscription boxes). The commoditized end is a race to the bottom. The differentiated end has room for margin, but requires genuine product innovation.
The pattern operators should notice: revenue concentration and margin opportunity often move in opposite directions. The biggest segments attract the most competition, which compresses margins. Smaller, less obvious segments may offer better economics precisely because the giants ignore them.
This is why citing total market size without segmentation is a red flag. Saying "we're going after a piece of $150 billion" means nothing. Saying "we're building in a $2 billion segment with 50% gross margins and fragmented competition" is a strategy.
Using Market Size Data Without Looking Like Everyone Else
The pitch deck trap is real: founders cite the big number because it sounds impressive, then watch investors' eyes glaze over. Here's how operators who actually understand their market use this data differently.
Lead with the segment, not the total. The sophisticated move is to barely mention the $150 billion and instead focus on your specific arena. "The pet supplement market is $3.4 billion and growing at 8% annually. We're focused on the joint health subcategory, which is $400 million with no clear market leader." This signals you've done the work.
Show the growth differential. If your segment is growing faster than the overall market, that's the insight. "While pet food growth has normalized to 4%, the fresh/frozen segment is growing at 12%." Investors care about category momentum, not just category size.
Name the competitive landscape, not just the opportunity. Market size data without competition analysis is incomplete. "The segment is $2 billion" means one thing if there are 500 subscale competitors and another if Mars owns 70% of it. Include both.
Acknowledge what you're not going after. Counterintuitively, showing what you're excluding builds credibility. "We're not competing in the mainstream dry food segment—that's a $40 billion knife fight with the majors. We're focused on the premium fresh segment where distribution and brand matter more than scale."
Use market data as context, not argument. The market size shouldn't be your argument for why you'll succeed. Product differentiation, distribution strategy, team—those are arguments. Market size is the backdrop that makes those arguments relevant.
The founders who get this right use data to sharpen their positioning rather than to impress with big numbers. They know investors have heard "$150 billion market" a thousand times and aren't moved by it.
What These Numbers Don't Tell You
Market size data has real limitations operators should understand.
It doesn't tell you about competition intensity. A $5 billion segment with five dominant players is harder to enter than a $500 million segment with none. The total addressable market matters less than who else is addressing it.
It doesn't capture margin dynamics. Revenue and profit are different. A high-revenue segment with compressed margins may be less attractive than a smaller segment with better economics. Market research firms report revenue because it's measurable. Margin data stays inside companies.
It aggregates away regional variation. National market size obscures that pet spending and competition vary dramatically by geography. The competitive landscape in Austin looks different than in rural Ohio. A national number may not reflect your actual market conditions.
It understates emerging categories. Market research measures what exists, not what's emerging. Categories like pet telehealth, pet insurance, and premium supplements are growing faster than the data suggests because the measurement frameworks haven't caught up.
It doesn't predict consumer behavior change. Market size is a snapshot. It doesn't tell you whether pet humanization trends will accelerate or plateau, whether inflation will shift spending patterns, or whether a recession would hit premium segments first.
For operators building strategies around where capital flows in pet, market size data is the starting point, not the answer. The founders who cite it correctly treat it as context that sharpens their positioning. The founders who cite it lazily treat it as validation—and investors can tell the difference.
The pet industry is worth $150 billion. That number is accurate. What you do with it determines whether it's useful.
Affiliated Products
Lorem ipsum dolor sit amet, consectetur adipiscing elit. Suspendisse varius enim in eros elementum tristique. Duis cursus, mi quis viverra ornare, eros dolor interdum nulla, ut commodo diam libero vitae erat.