
Reports
Original research, market analysis, and data from across the pet industry - from our team and select partners.
All Reports
Trends, opportunities, and analysis sourced from proprietary research, private companies, and public data.
Pet Industry M&A Report 2026
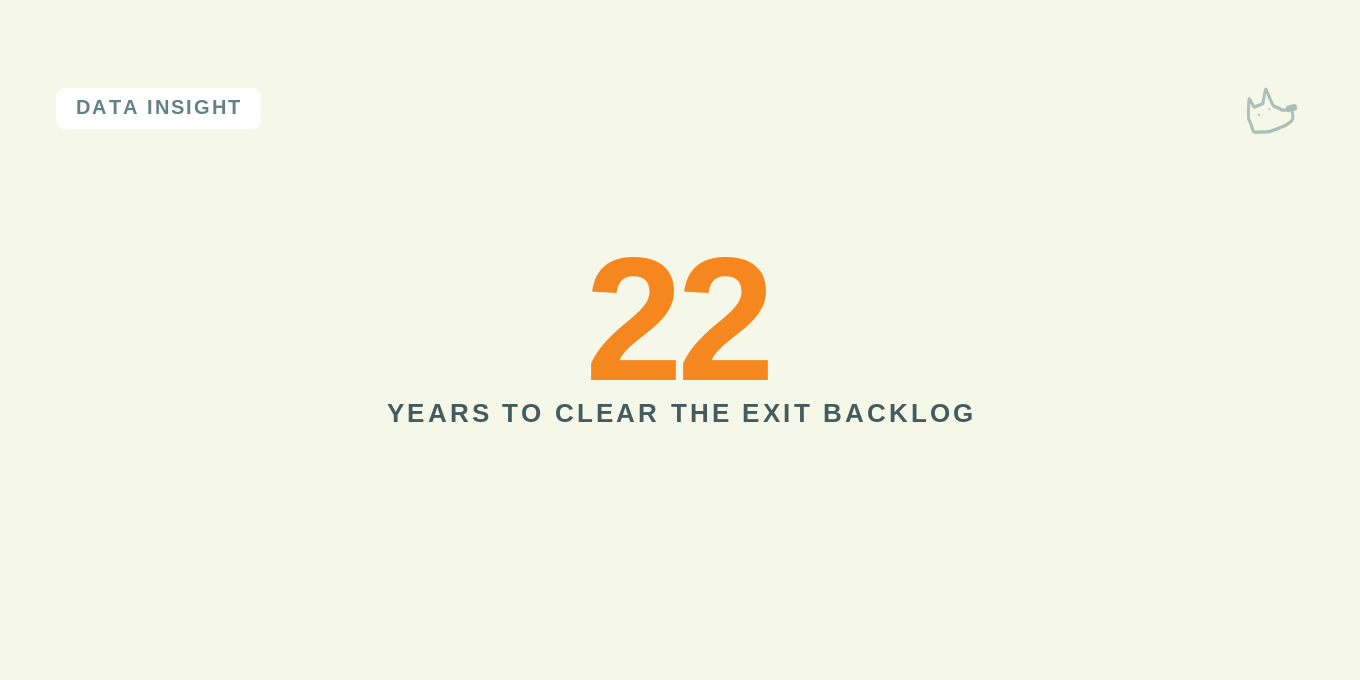
At the pace sponsors have actually exited pet platforms since 2023, clearing the backlog of PE-formed pet companies still waiting for a sale would take roughly 22 years. This Pro Report independently verifies 12 pet-industry deals from Jan–July 2026, builds the Exit Backlog Index across three scenarios, and finds that every 2026 buyer already owned a pet company, that broken financing math has erased the old buy-and-flip arbitrage, and that public deal counts capture only a third of actual market activity.
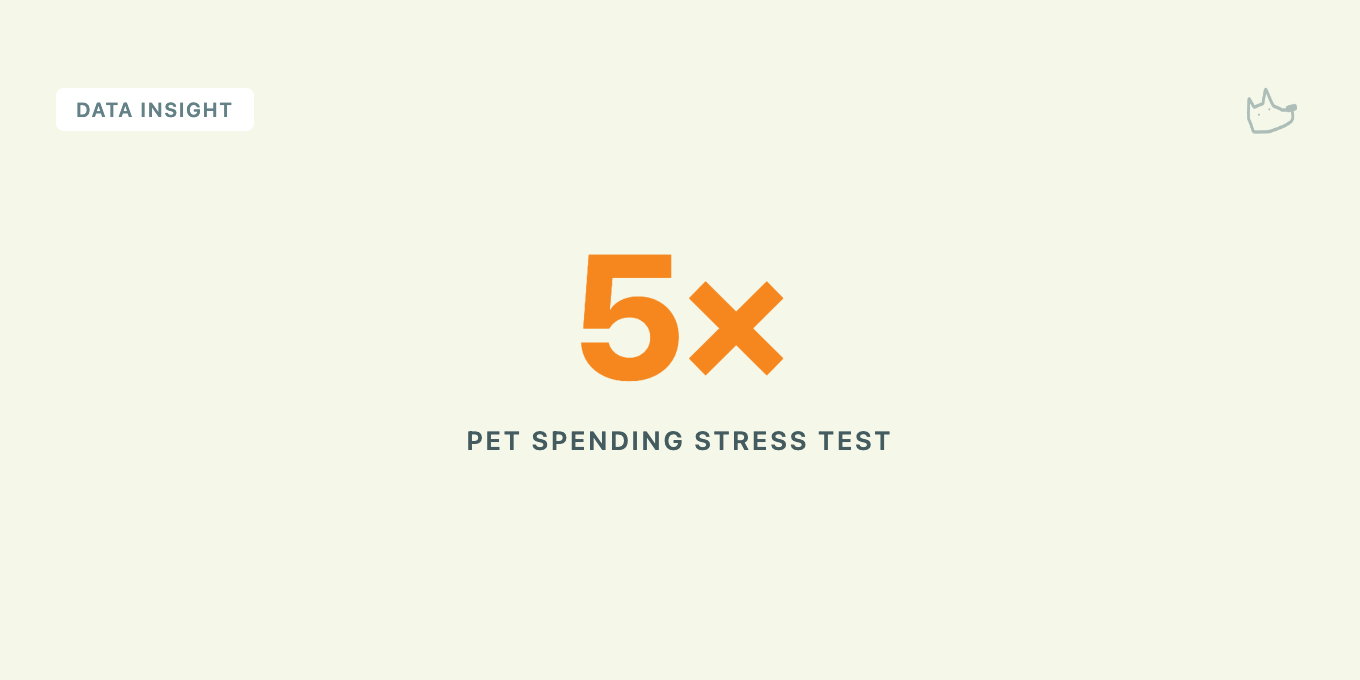
The Pet Spending Stress Test
Vet services inflation is running 5× faster than pet food inflation. That gap explains why some pet categories are resilient and others are breaking — and it's visible before earnings tell you.

Who's Buying the Pet Industry
We tracked 50 confirmed pet industry transactions over 12 months. Six repeat acquirers executed more than a third of them — and the pattern they're forming tells you exactly where the moat is moving.
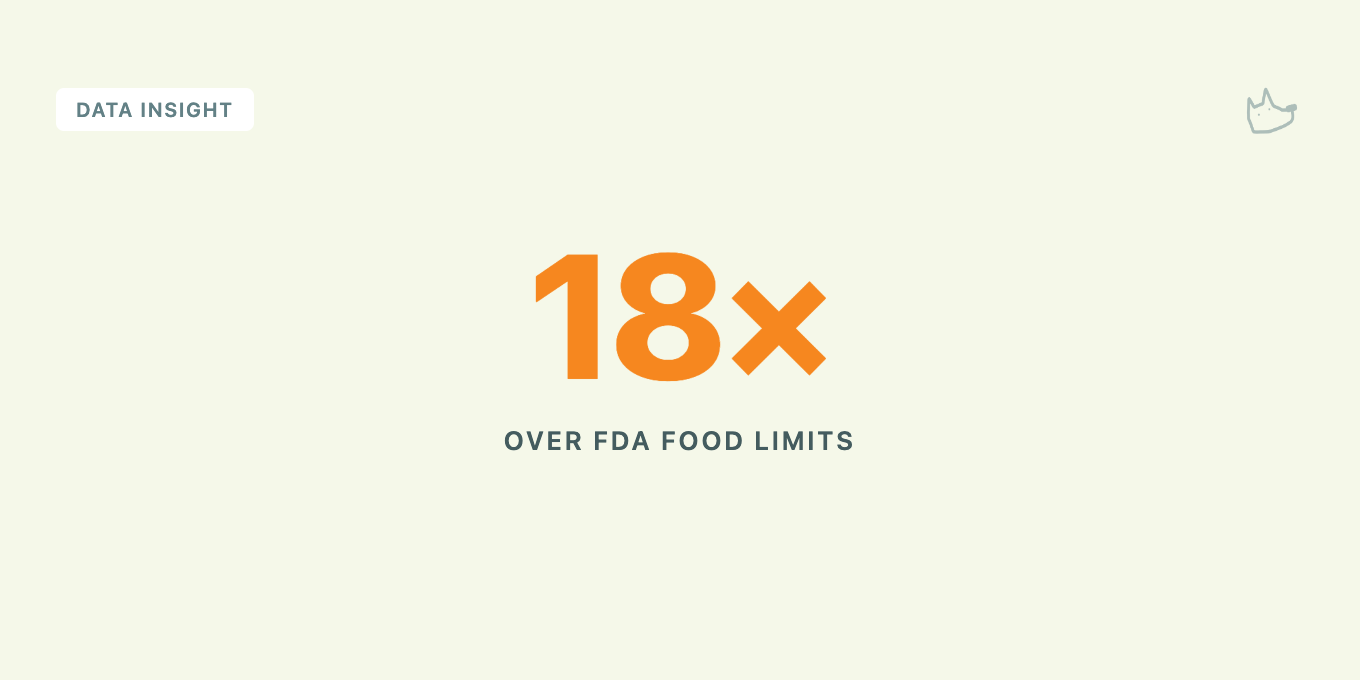
Apply FDA Baby Food Standards to Dog Food. The Math Is Ugly.
The Clean Label Project tested 79 dog foods for heavy metals and contaminants. The headlines focused on which formats were worst. We asked a different question: what happens when you map those results against the specific FDA action levels that define safety for human food? Consider that the allowable lead in pet food is 1,000 times higher than what the FDA now permits in baby food. The gap between those two worlds isn't a rounding error. It's a multiplier — and it applies to every major contaminant with a federal benchmark.

The $600M Pet Wellness Service Nobody Is Offering
59% of American dogs are overweight. The technology to measure it precisely exists — and nobody's offering it. We sized the market, modeled the unit economics, and ranked seven metros for launch. Break-even: 4 scans per day.
The Pet Protection Gap: Where Vet Deserts and Insurance Deserts Collide
One in six American pets lacks both veterinary access and insurance coverage. This analysis maps the overlap — and sizes the opportunity for insurers, care providers, and investors willing to build outside metro cores.

San Francisco Dog Daycare Now Costs More Than American Childcare
The humanization trend has a price tag. In San Francisco — where dogs outnumber children 2:1 — pet owners now pay more for dog daycare than the average American family pays for childcare. Seattle and NYC are 18-24 months behind.
Houston Needs 1,200 More Groomers — Here's the Math
PetSmart and Petco followed population into Houston, Phoenix, and Atlanta. Groomers and boarders didn't. We built a Service Gap Index comparing retail density to service density by metro — and found a 2.8× imbalance in Houston alone. That's $287M in annual revenue waiting for whoever fills it.
5% of Insured Dogs. 22% of Claim Dollars. The Breed Risk Index.
French Bulldogs pay 11% higher premiums but generate 340% higher claims costs. We built the Breed Risk Index by blending AKC registration data, Nationwide's brachycephalic study, and Royal Veterinary College health prevalence rates. The result: a 4.4× risk concentration most underwriters aren't accounting for.
The Data
Key data points from our research, reports, and ongoing coverage of the pet industry.
4
First-mover business opportunities identified in new categories
52%
Of pet health spend is driven by pets aged 7+, despite representing a minority of the population
Unlock
Get full access to reports, interviews, webinars and more subscriber-only analysis when you join our pro plan.
Interviews
Access conversations with founders, operators and decision makers building inside the pet industry
2.4x
Per-pet service spend has grown faster than product spend since 2019
41%
Of top pet-spending U.S. metros rank below average for preventive care usage.